Dashboard
Filter by
SubjectRequired
LanguageRequired
The language used throughout the course, in both instruction and assessments.
Learning ProductRequired
LevelRequired
DurationRequired
SubtitlesRequired
EducatorRequired
Results for "dashboard"
Coursera Project Network
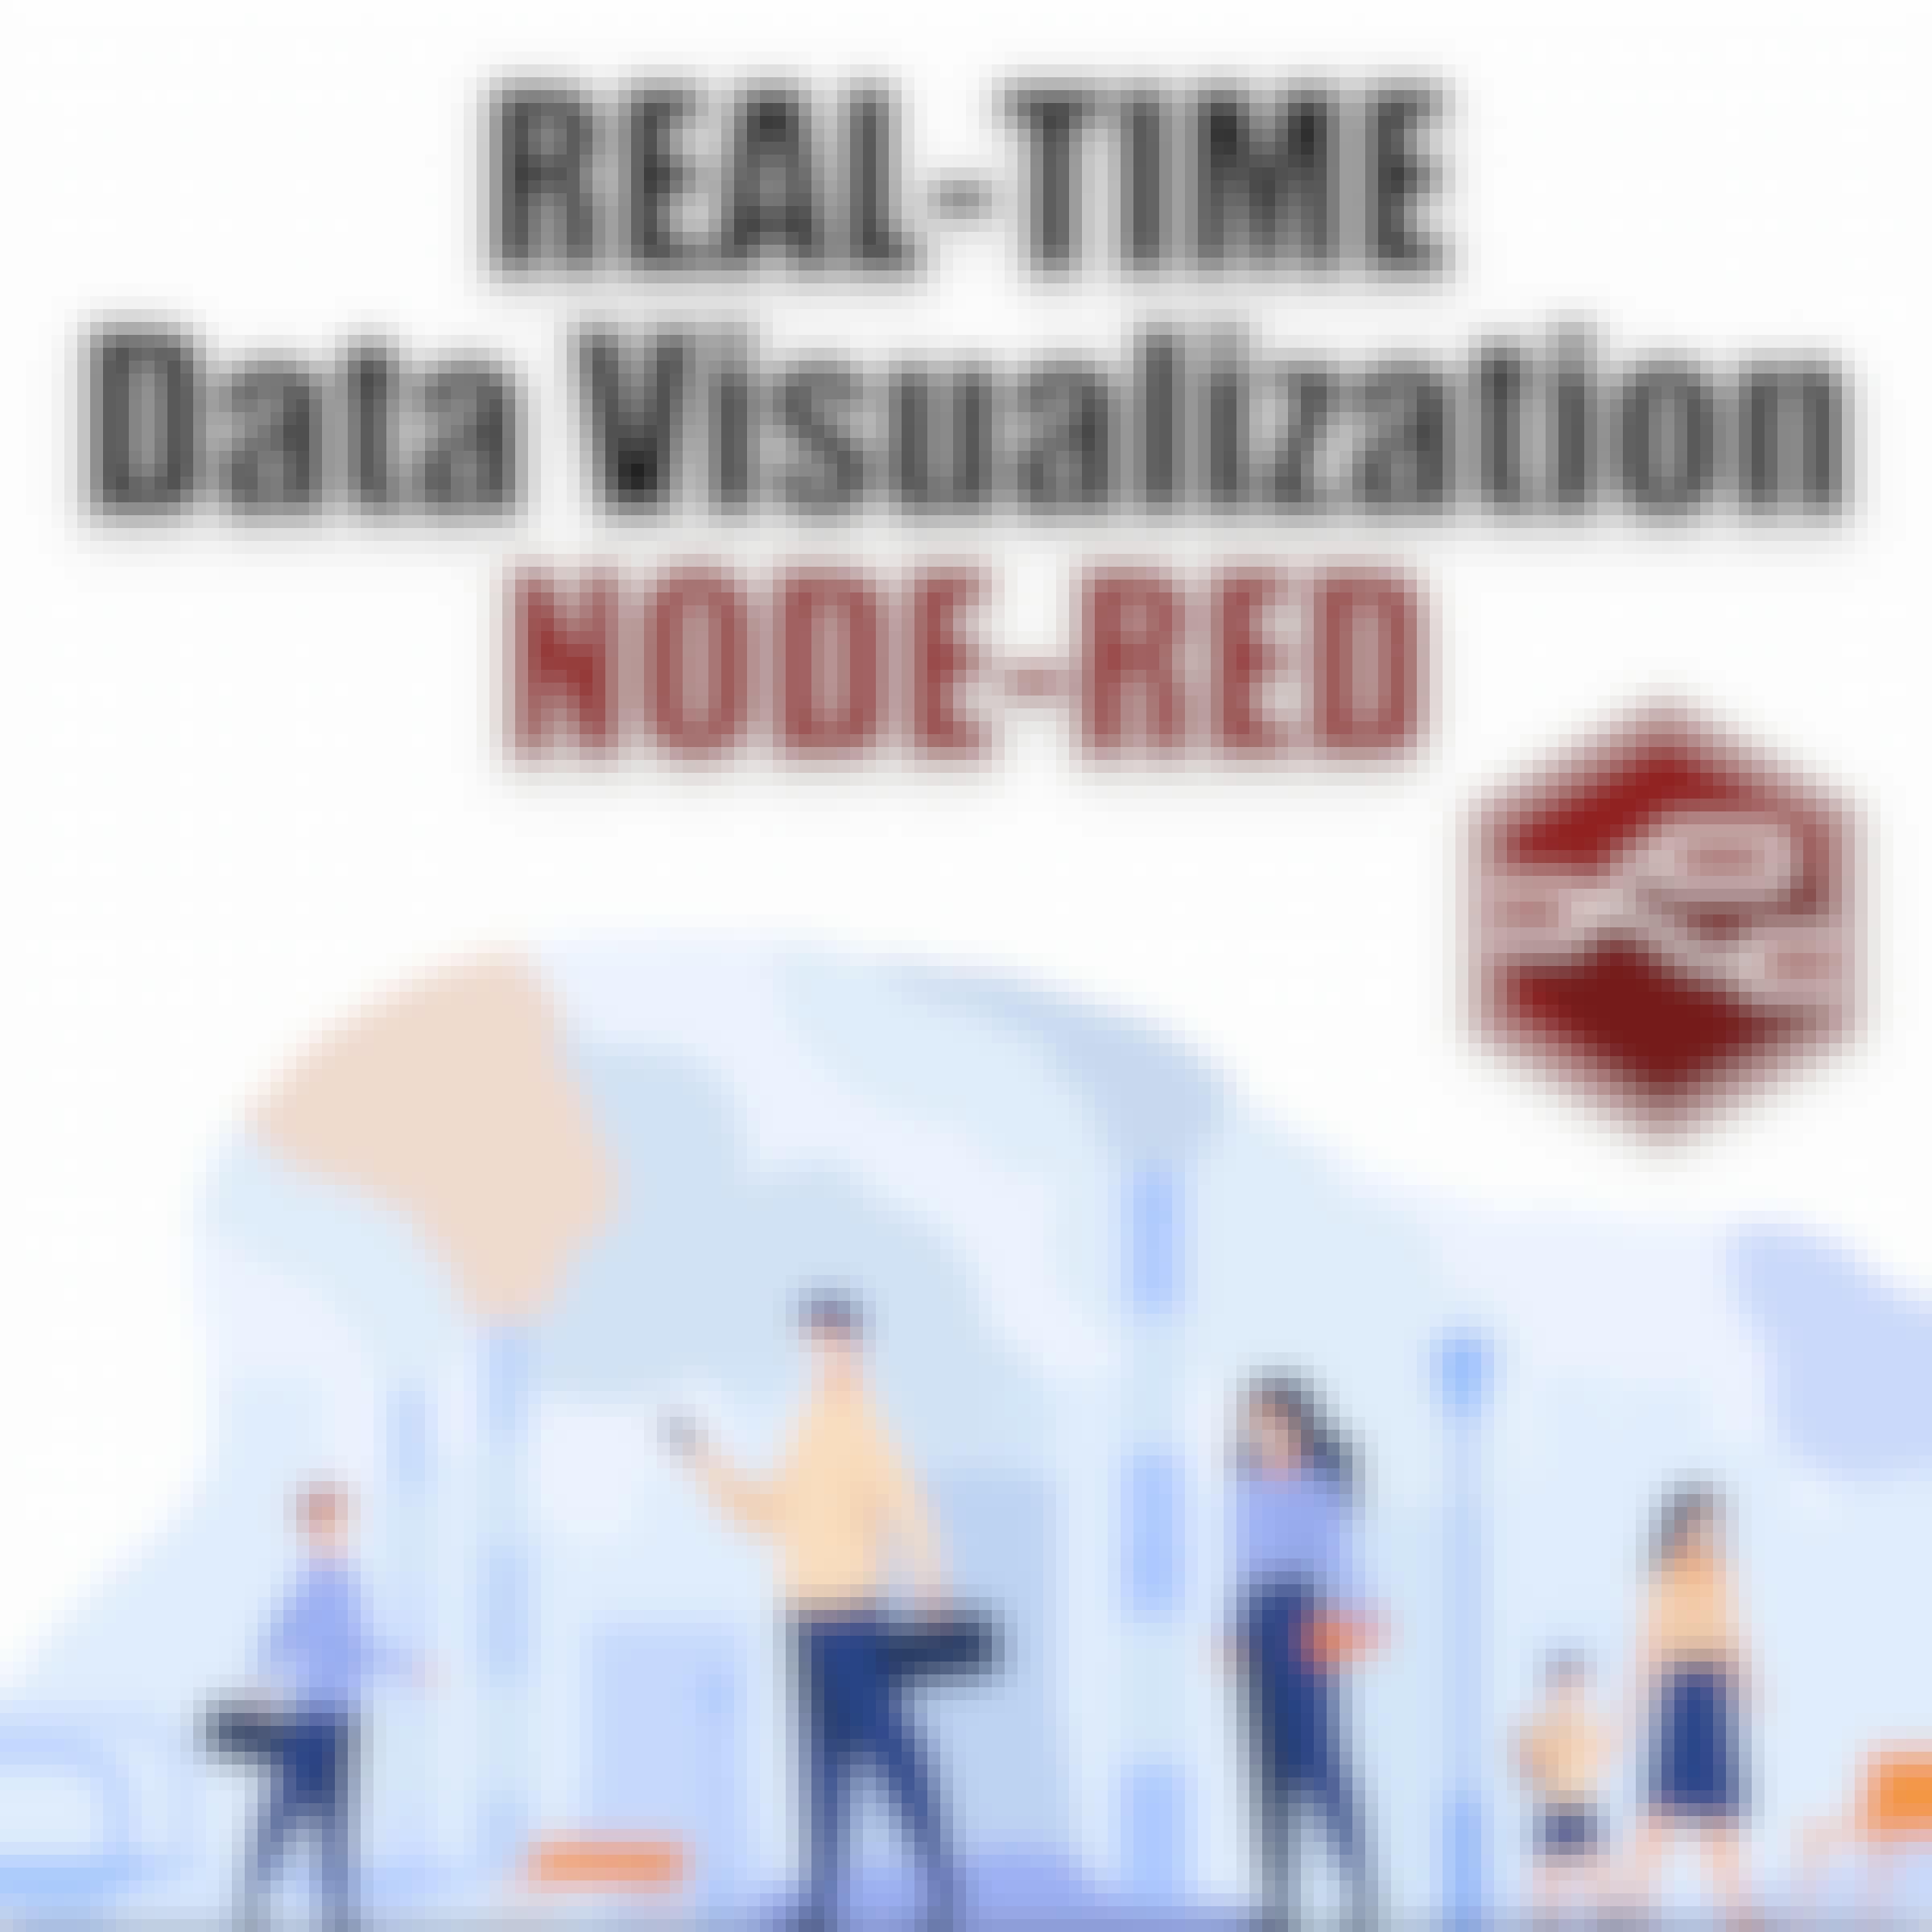
Skills you'll gain: Dashboard, Data Visualization Software, Real Time Data, Data Processing, Node.JS, Data Analysis, Application Programming Interface (API), Web Development Tools, JSON, Javascript
 Status: Preview
Knowledge Accelerators
Skills you'll gain: Power BI, Data Import/Export, Business Intelligence, Data Transformation, Microsoft Power Platform, Data Visualization, Dashboard, Data Visualization Software, Data Presentation, Microsoft Excel, Interactive Data Visualization, Data Cleansing, Microsoft Teams, Business Analytics, Data Analysis, Management Reporting, Microsoft 365, Data Modeling, Microsoft Office, Data Science
 Status: Preview
Campus BBVA
Skills you'll gain: Data Storytelling, Data-Driven Decision-Making, Data Visualization, Business Analytics, Dashboard, Data Quality, Data Analysis, Descriptive Statistics, Business Intelligence, Business Analysis, Statistical Methods, Probability & Statistics, Statistical Inference, Big Data, Statistical Analysis
 Status: Preview
Coursera Instructor Network
Skills you'll gain: Data Visualization, Data-Driven Decision-Making, Data Visualization Software, Data Literacy, Interactive Data Visualization, Business Intelligence, Data Storytelling, Data Presentation, Dashboard

Google Cloud
Skills you'll gain: Looker (Software), Dashboard, Interactive Data Visualization, Data Visualization, Exploratory Data Analysis, Google Cloud Platform, Data Analysis, Cloud Computing

Coursera Project Network
Skills you'll gain: Scheduling, Social Media Management, Social Media Content, Social Media, Cloud-Based Integration, Productivity Software, Dashboard, Digital Marketing, Business
 Status: Free
Coursera Project Network
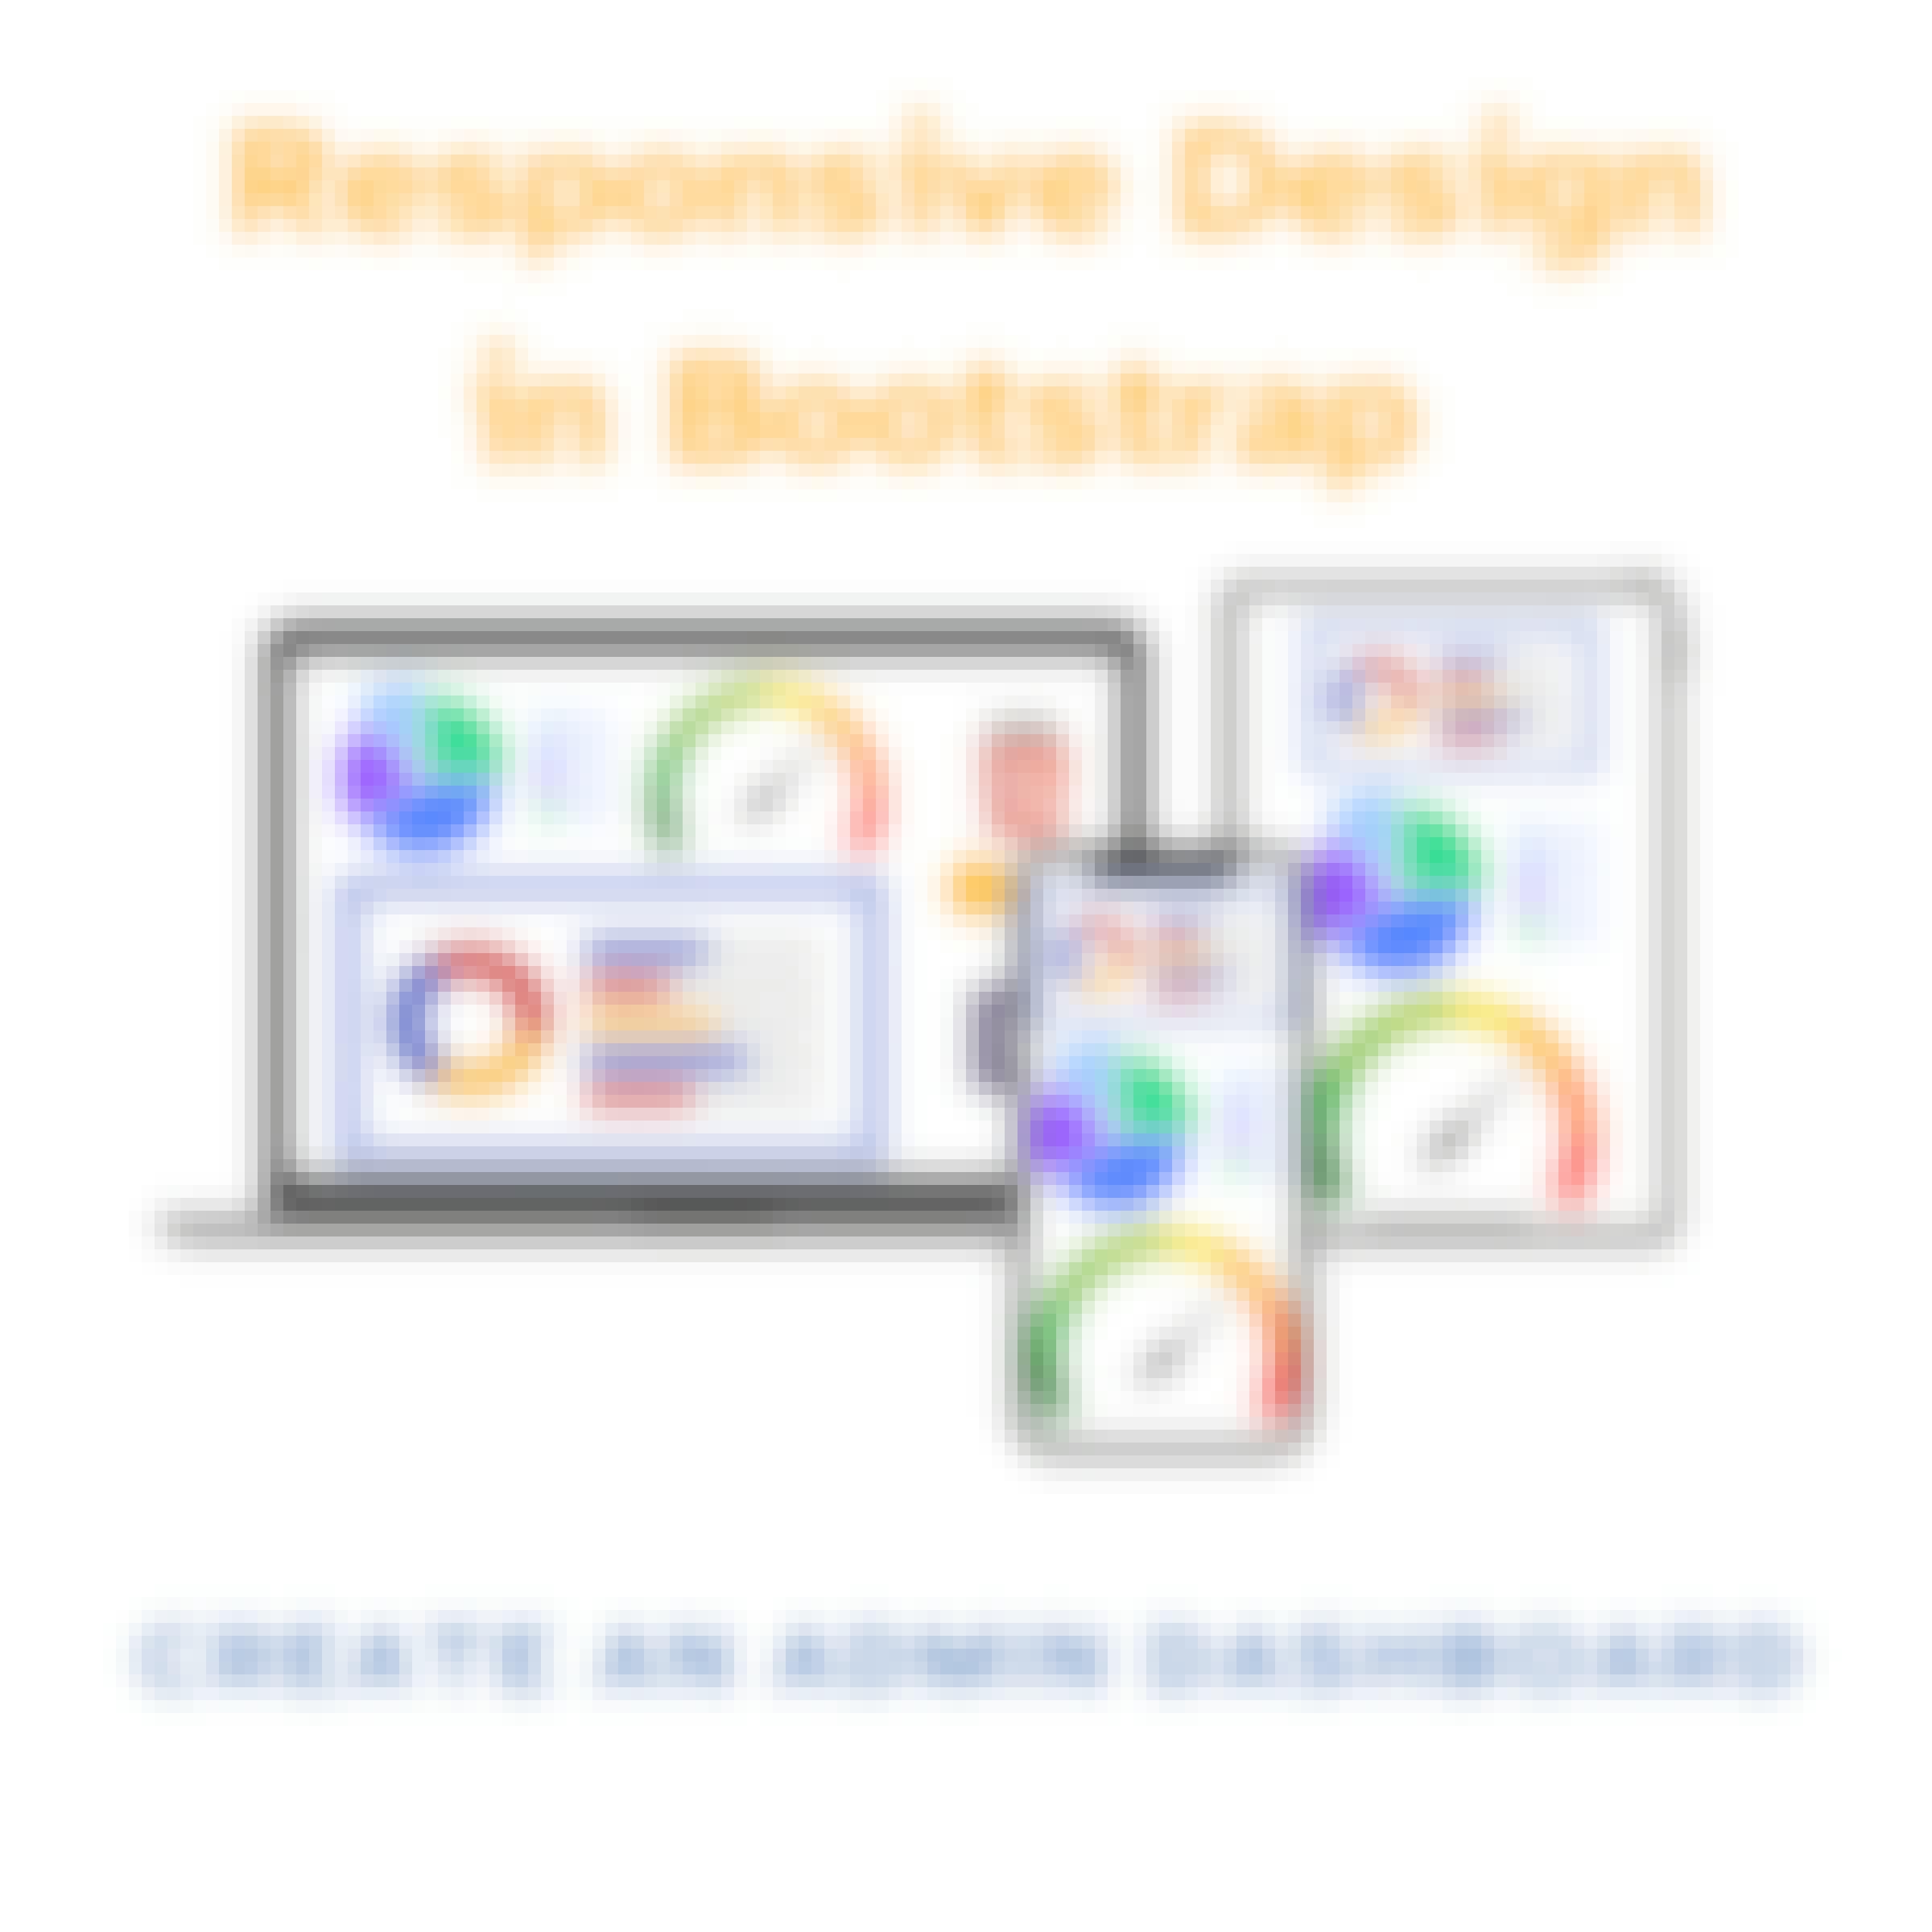
Skills you'll gain: Chart.js, Responsive Web Design, Bootstrap (Front-End Framework), Dashboard, HTML and CSS, Data Visualization, Web Design, Web Applications, User Interface (UI), User Interface (UI) Design, Web Development
 Status: Free Trial
Skills you'll gain: Customer Success Management, Salesforce, Dashboard, Sales Operations, Sales Enablement, Customer Relationship Management, Data Visualization, Customer Support, Sales Management, Customer and Client Support, Customer Service, Sales Strategy, Performance Reporting, Business Reporting, Data-Driven Decision-Making
 Status: Free Trial
SkillUp
Skills you'll gain: Tableau Software, Peer Review, Data Storytelling, Dashboard, Presentations, Data Cleansing, Business Intelligence, Data Visualization Software, Data Visualization, Interactive Data Visualization, Data Quality, Data Manipulation, Data Analysis, Key Performance Indicators (KPIs), Data Import/Export
 Status: Preview
Skills you'll gain: Power BI, Data Analysis Expressions (DAX), Interactive Data Visualization, Data Storytelling, Dashboard, Data Visualization Software, Business Intelligence, Data Security, Data Integration, Data Transformation, Data Management, Data Modeling, Data Cleansing, Software Installation
 Status: Free Trial
Johns Hopkins University
Skills you'll gain: Shiny (R Package), Dashboard, Ggplot2, Interactive Data Visualization, Data Visualization Software, Statistical Visualization, Data Presentation, Application Development, UI Components, User Interface (UI), Application Deployment
 Status: Free Trial
Corporate Finance Institute
Skills you'll gain: Dashboard, Tableau Software, Interactive Data Visualization, Data Visualization Software, Data Presentation, Data Modeling, Data Storytelling, Data Manipulation, Data Import/Export, Business Intelligence, Data Transformation, Data Integration, Data Analysis